Reading time: minute(s)
 Deutsch
 English
 Français
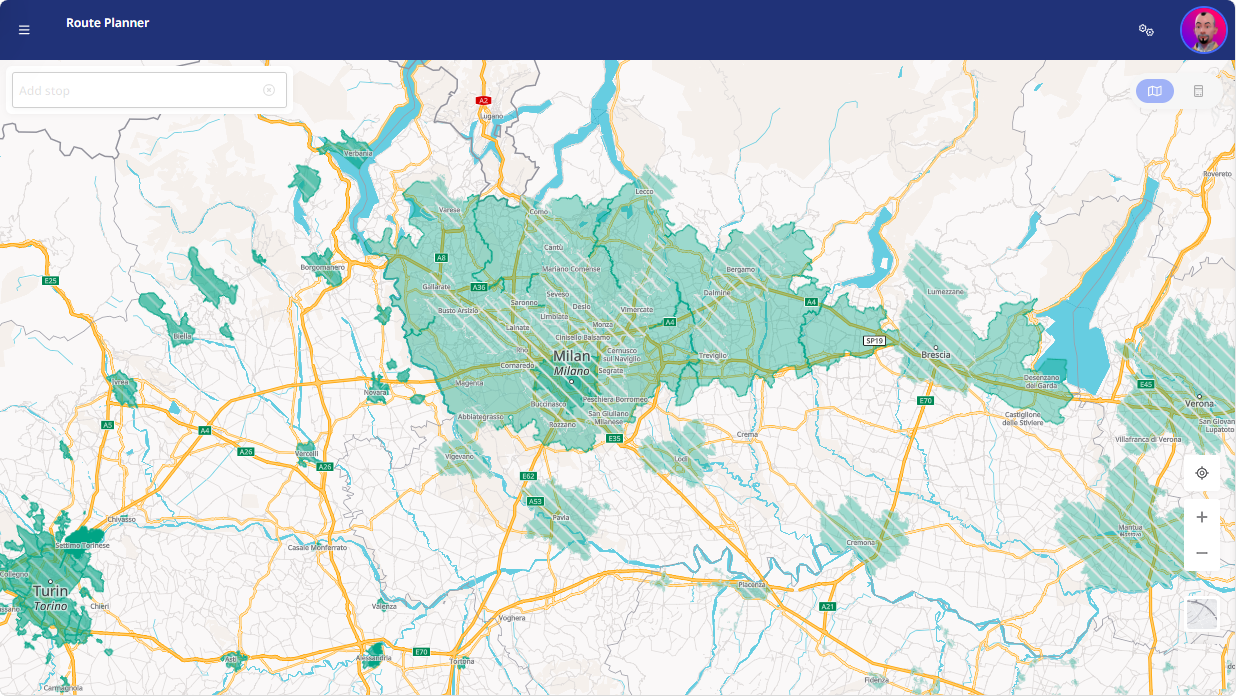
Route Planning
With the Route Planning module, you can create routes with up to 250 stops.
Note: The first time you open the page, your browser will ask for permission to access your location.
-
Access allowed → The map shows your current location.
-
Access denied → The map is centered on Europe .
Further information can be found in the sections below:
 General Information
|
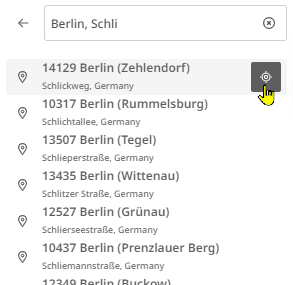
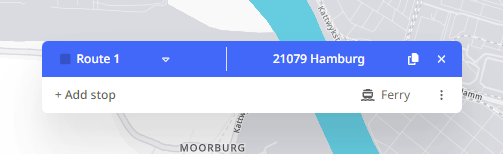
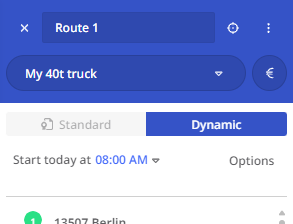
You can add stops in two ways:
|
|
Once you have selected multiple stops, you can configure route calculation settings and calculate the route. Two modes are available:
|
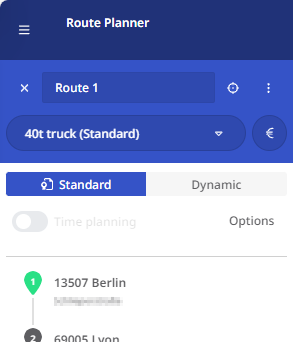
|
The calculated route is displayed on the map:
-
On the left, you see the stop list with the route sequence. For details, see the section “Information in the stop list” .
-
On the right, you’ll find information on distance, time, cost, and emissions – depending on the selected calculation mode and the settings for each stop and the vehicle and cost profile.
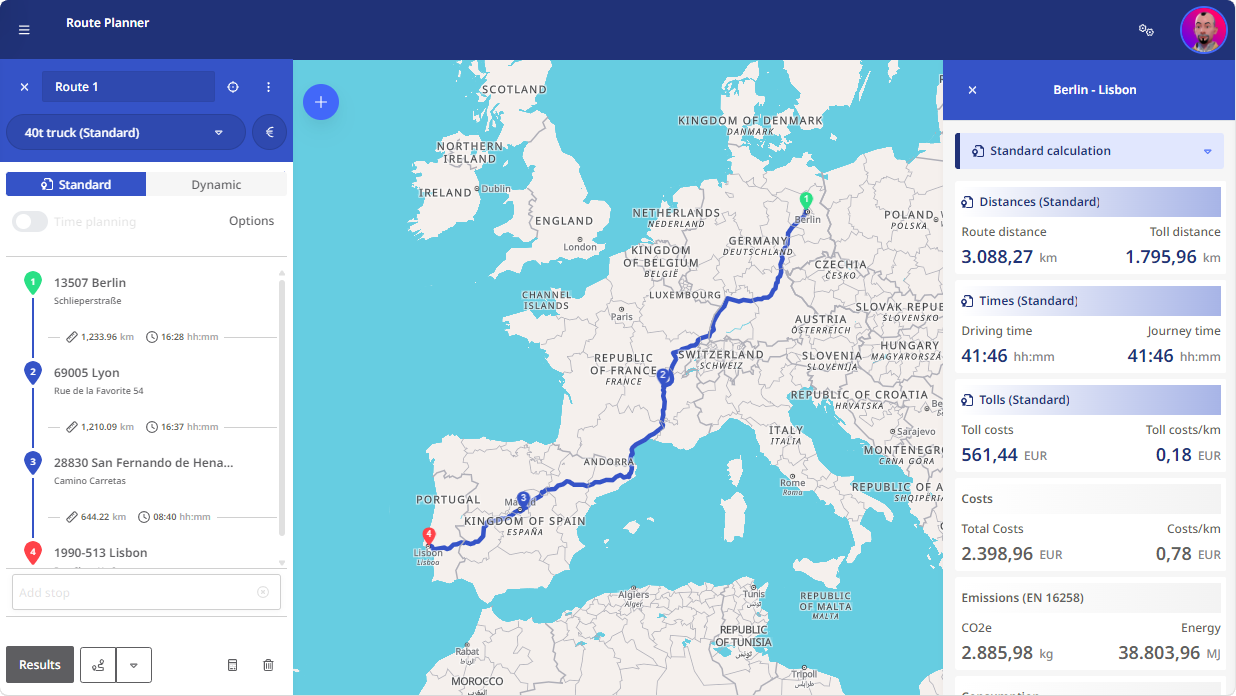
Detailed information on the right-hand panel can be found in the section “Route Details”.
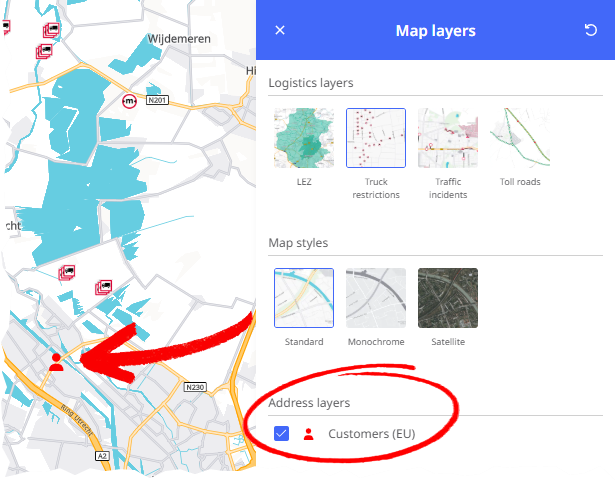
Show/Hide Map Layers
|
In the map view, you can enable additional layers to better plan your route. Multiple layers can be displayed simultaneously. The button
|
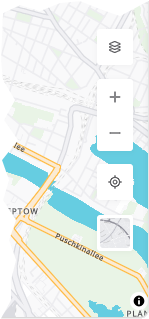
|
 for this is located at the bottom left of the map view. Clicking it opens a menu for Logistics Layers, Map Style and Address layers.
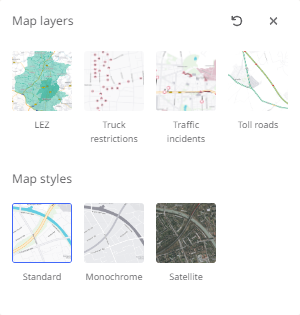
Available map layers:
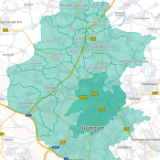
Environmental Zones
|
The Environmental Zones layer shows zones in many European cities. This helps with planning and selecting the appropriate vehicle. You can show the layer in the “Map layers” menu. |
|
Display:
-
Permanent environmental zones : solid color
-
Temporary air protection zones : hatched (activated by cities as needed)
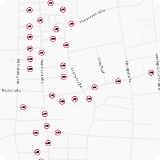
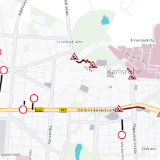
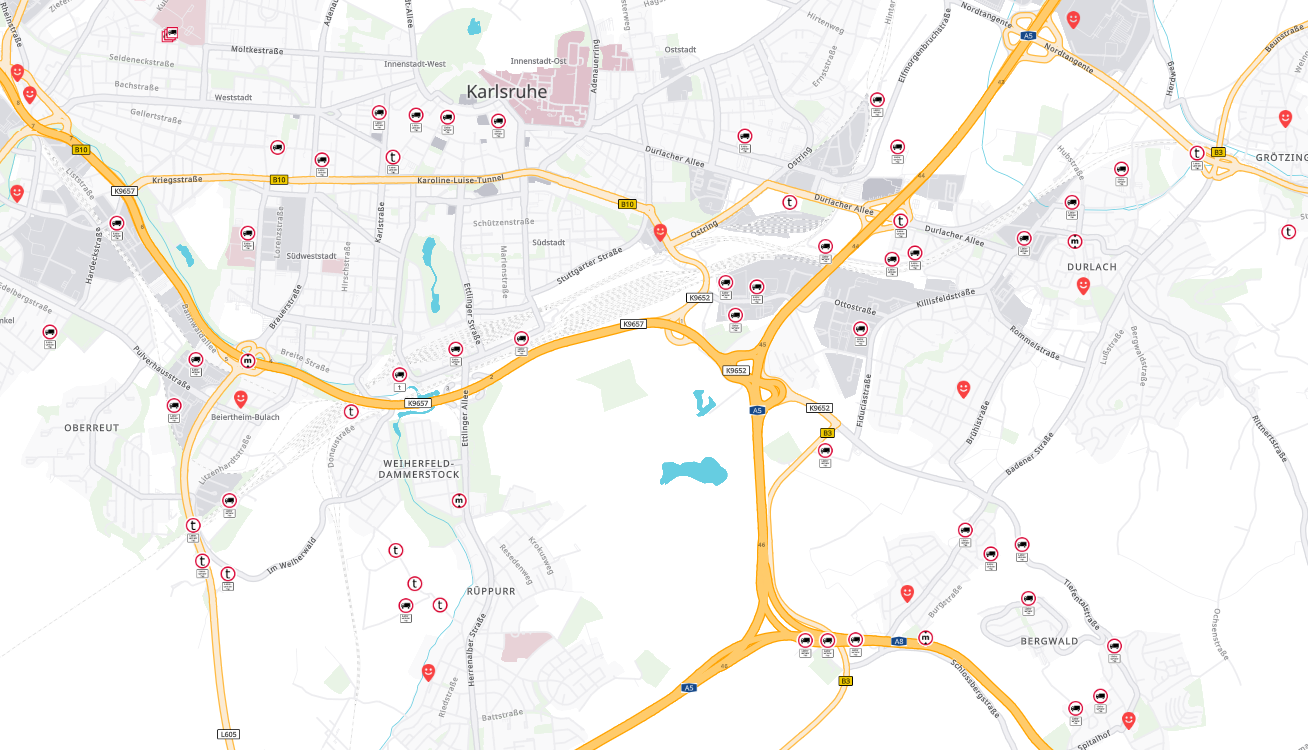
Truck Restrictions
|
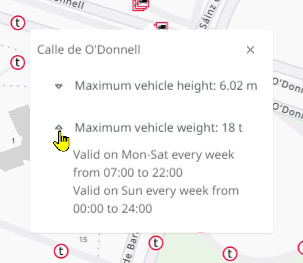
This layer shows truck-specific restrictions in the current map area. You can show the layer in the “Map layers” menu. This layer shows truck-specific restrictions in the current map area. Hovering over a symbol displays a tooltip with details. Multiple restrictions on a road segment are shown together.
Below is a legend for the respective symbols. |
|
| Symbol | Meaning | Unit | Description of the restriction type |

|
Several restrictions on the same road section. |
Combined restrictions | |

|
The maximum permissible vehicle height. |
m | Height restriction |

|
The maximum permissible vehicle weight. | t | Weight restriction |

|
The maximum permissible vehicle width. |
m | Width restriction |

|
The maximum permissible vehicle length. | m | Length restriction |

|
The maximum permissible axle load. | t | Axle load limitation |
|
|
Limited number of axles. | Limited number of axles | |

|
The tunnel restriction code B. | Tunnel restriction: Code B | |

|
The tunnel restriction code C. | Tunnel restriction: Code C | |

|
The tunnel restriction code D. | Tunnel restriction: Code D | |

|
The tunnel restriction code E. | Tunnel restriction: Code E | |

|
Not permitted for vehicles transporting dangerous goods. | Dangerous goods not permitted | |

|
Not permitted for vehicles carrying goods hazardous to water. | Water-polluting goods not permitted | |

|
Not permitted for vehicles transporting flammable substances. | Fireworks not permitted | |

|
General truck restriction, regardless of whether a truck has a trailer or not. | General access restriction | |

|
Trucks with trailer restrictions. | Trucks with trailer restrictions | |

|
Length restriction for trucks with trailers. | m | Length restriction for trucks with trailers |

|
Width restriction for trucks with trailers. | m | Width restriction for trucks with trailers |

|
General truck restriction except for delivery vehicles. | General access restriction except for deliveries | |

|
The maximum permissible vehicle weight with one exception for delivery vehicles. | t | Free for deliveries |
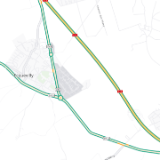
Traffic incidents
|
The Traffic incidents layer shows current incidents in the map area – e.g., construction sites or access restrictions. You can show the layer in the “Map layers” menu. Display:
|
|
Toll Roads
|
The Toll Roads layer shows roads where toll fees apply. You can show the layer in the “Map layers” menu. |
|
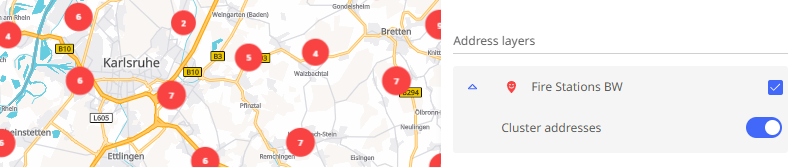
Address layers
|
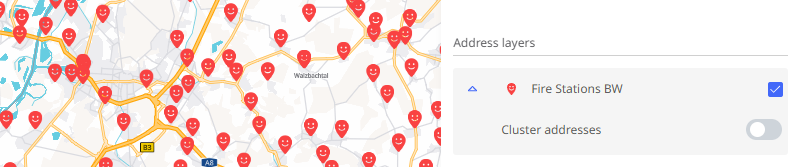
If you have created address layers via theData management module, these are displayed under the available map layers. You can activate address layers via the "Map layers" menu. Display addresses as clustersIf an address layer contains many addresses, e.g. in a metropolitan area, the map view can become confusing.
In this case, it is advisable to use the "Cluster addresses" function. This groups the address areas in the individual areas according to the zoom level and the map section.
|
|
If you click on one of the clusters or zoom in on the area of this cluster, the map view shows,
-
in the case of a larger clusters, several smaller clusters, or
-
for smaller clusters, the individual addresses of the cluster.
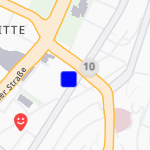
Several saved addresses at the same main address
|
A special case of address clustering is when several stored addresses are located at the same street address. A classic example is when several customer addresses are stored as addresses in a larger building with the same street address. In such a case, this cluster is not resolved by manual zooming. The number of addresses in the cluster is displayed next to the cluster symbol on the map. |
|
|
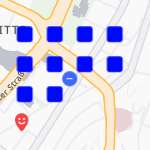
If you click on the address cluster icon, the individual addresses are displayed as a grid around the main address. |
|
 Choose Map Style
You can switch between different map styles at any time – according to your visual preferences.
|
|