Comparing routes
You can display the routes and alternative routes from up to five tabs on the map and compare the results.
Display on the map
To do this, select the desired tabs by clicking on the checkbox. The routes calculated in the tabs are displayed on the map in different colours.
You can see which routes belong to which tab by the colour they are highlighted in.

Tip: If the colours of the routes are difficult to tell apart, you can change the map's colour scheme.
In the map, click on  and choose, for example, the colour scheme Silkysand from the drop-down list.
Comparing routes
You can compare routes that you have calculated with different vehicle profiles or routing options, for example, and display the differences. For trips with a pre-run and a post-run, you can also see the costs of the complete trip, for example by subcontractor.
|
The comparison always starts from the route in the active tab. As soon as at least one route has been calculated, the active tab is automatically selected
|
|
You can select the tabs you want to compare to the current route by clicking the checkbox to the left of the route name. The calculated routes are displayed in a different colour on the map. If a tab only contains stop-off points, the route is calculated automatically. |
-
Calculate at least two routes.
Note: You can compare a maximum of five routes.
-
If required, switch to the tab with the route you want to compare to other routes.
The tab is selected automatically
 and the calculated routes are displayed on the map.
 -
Select the tab whose routes you want to compare. To do this, click the checkbox to the left of the route name
. -
On the toolbar, click
 Compare.
 The Compare routes window will open.
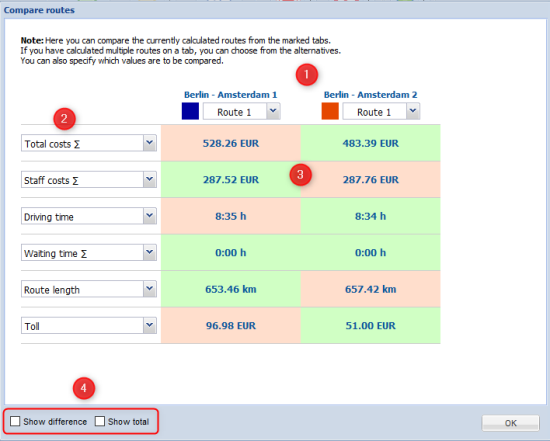
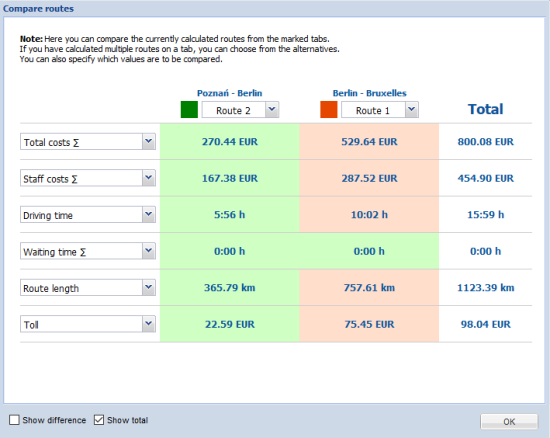
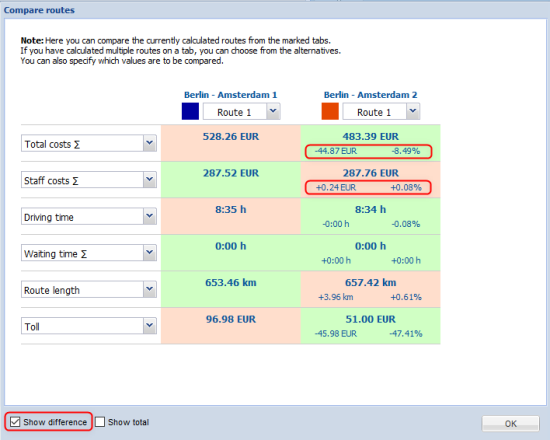
 Use the top drop-down lists to specify which routes from the selected tabs should be compared.
 Use the drop-down lists on the side to specify which values should be compared.
 The best values of the compared routes are displayed in green, the poor ones in red.
  You can show the difference between the values or add up the values.
Difference
The absolute and percentage difference to the best value are displayed for all values.
Total
The total is useful, for example, if a trip is operated by several subcontractors with different cost rates.