With the new version, we offer you many functions that make working with PTV Map&Guide intranet even easier.
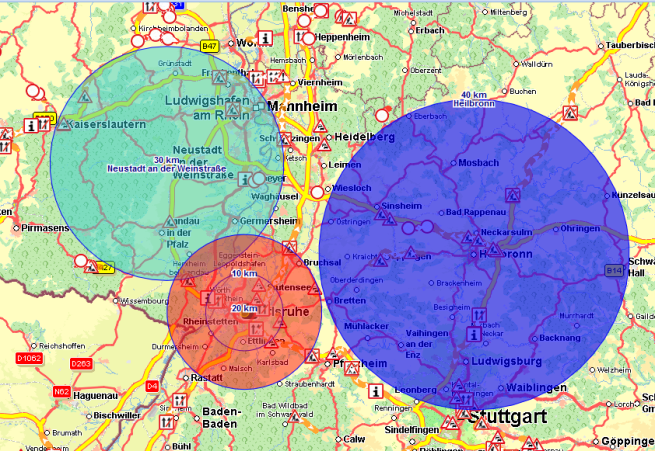
The Perimeters use case gives you the option to draw a circle around one or more addresses on the map. You can set the radius and enter the colour and a label.
This lets you show different tariff zones on the map, for example, enabling you to quickly provide a customer with information about freight pricing.
More information can be found in the article Draw and edit perimeters in the map.
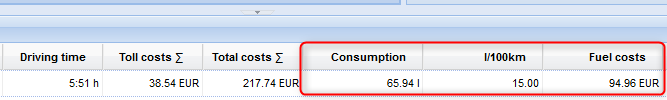
In the new version, you can see the exact fuel costs incurred on a route. You can enter the fuel costs in the cost profile (see Create cost profile ) and the costs for the journey will be shown in the route calculation result once you have calculated the route.
By double-clicking on a route planning tab you can change its name.

If you want to show the tab again when you next start it up, you must save the profile.
In the title bar click  My account > Save profile.
The window PTV Map&Guide intranet - Save profile opens.
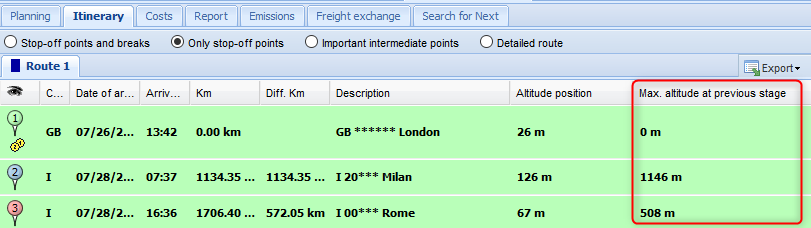
The itinerary includes the height data for every route point and for the previous stage
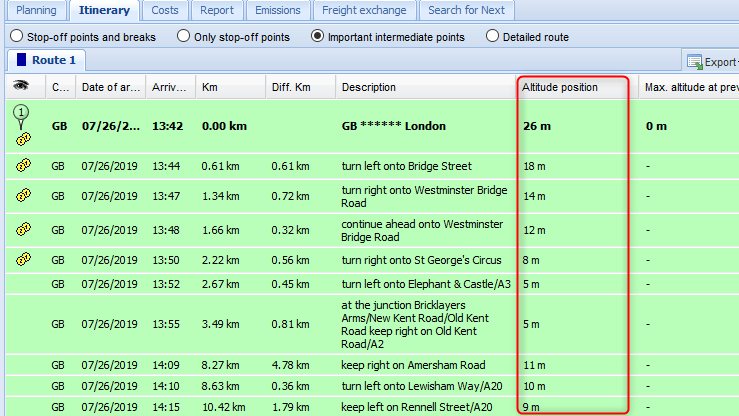
If you only show the stop-off points, the maximum height for the previous stage will be shown (taking the example of the 1st stage: stop-off point 1 to stop-off point 2, 2nd stage: stop-off point 2 to stop-off point 3).
The route calculation result also shows the highest and lowest points on the route.
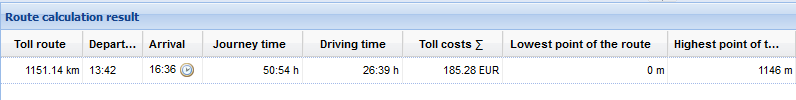
Tip: Double-click on the highest or lowest point to display it on the map.
More information can be found in the article Where do I see the height profile of a route?
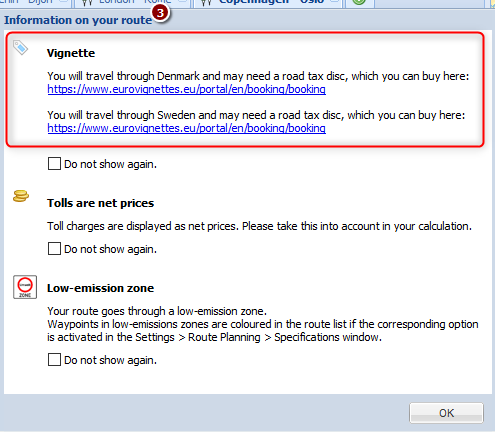
If the route passes through countries which require a toll sticker, once you have calculated the route you will receive a notification to this effect with a link to a page where you can purchase the sticker.
In the map, you can use Context menu >  Copy map to show the current map section in a new browser tab. You can copy the image there, place it on the clipboard and insert it into a document.
Note: To insert the image into Microsoft® Word®, for example, right-click on your chosen point in the document, choose Insert from the menu and click on the  Picture symbol.
The function Compare routes has been revised and improved. Up to now, it was only possible to compare routes from two tabs via CTRL + mouse click. In the new version you can mark and compare routes from up to five tabs comfortably with the mouse.
Note: The comparison via CTRL + mouse click is no longer possible.
You can compare routes, which were calculated with with different vehicle profiles or routing options and display the differences. It is also possible to display the costs of an entire tour, for example if a part of a tour is executed by a subcontractor.
|
The comparison is always based on the route in the active tab. Once at least one route has been calculated, the active tab is automatically marked
|
|
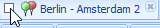
You can mark the tabs with which you want to compare the current route by clicking on the checkbox to the left of the route name. The calculated routes are displayed in a different color on the map. If a tab only contains stop-off points, the route is calculated automatically. |
Calculate at least two routes.
Note: You can compare a maximum of five routes.
Click on the tab with the route that should serve as the basis for the comparison.
The tab is automatically marked and the calculated routes are displayed on the map. .
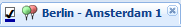
Mark the tabs whose routes you want to compare by clicking on the checkbox to the left of the route name .
In the toolbar click on  Compare.
The Compare routes window opens.
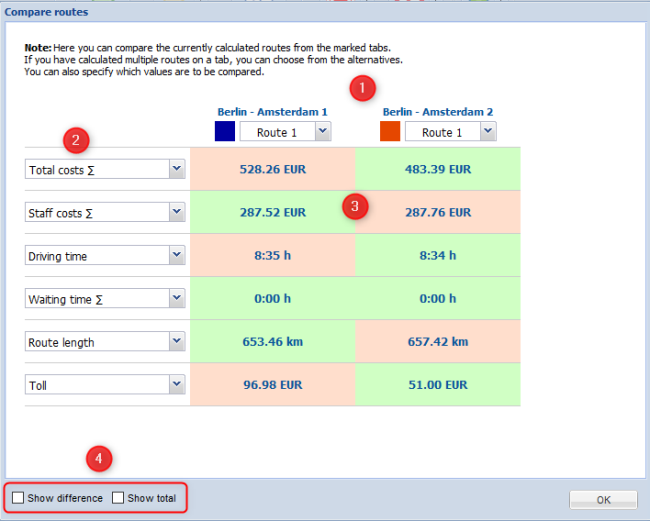
 You can use the upper drop-down lists to specify which routes are to be compared from the marked tabs.
 You can use the drop-down list on the side to specify which values are to be compared.
 The best values of the compared routes are shown in green, the bad ones in red.
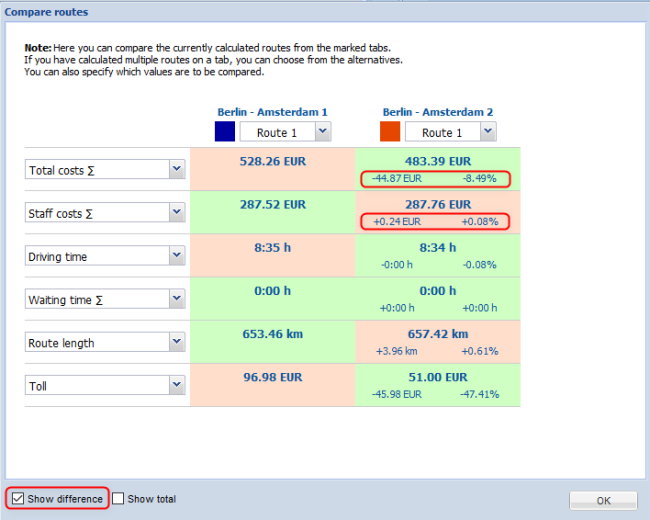
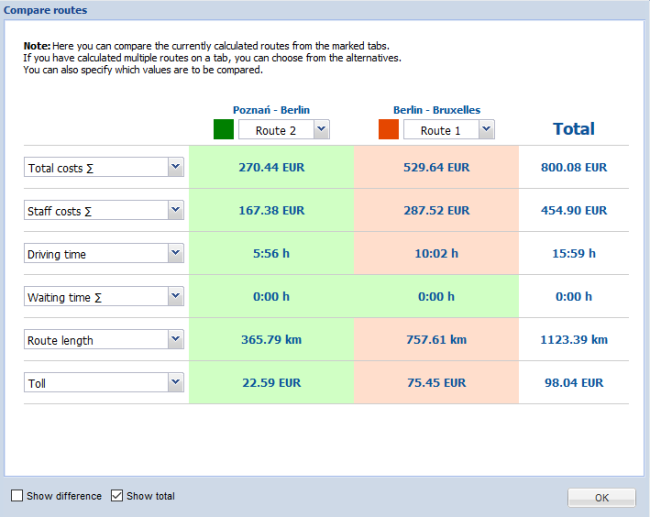
 You can display the difference between the values or sum up the values.
For all values, the absolute and percentage difference to the best value is displayed.
Displaying the total is helpful, for example, if a tour is run by several subcontractors with different rates.
You can view the routes and alternate routes from up to five tabs in the map.
To do this, mark the desired tabs by clicking on the check box. The routes calculated in the registers are displayed in different colors on the map.
Which routes belong to which register is indicated by the color of the marking.

Tip: If the colors of the routes are difficult to distinguish, you can change the color scheme of the map. Click on  in the map and select another the color scheme, for example Silkysand.
You can move tabs with the mouse. Click on a tab, hold down the mouse button and move it to the desired position. If a green arrow ![]() appears between two tabs, you can "drop" the tab.
appears between two tabs, you can "drop" the tab.
Note: The stop-off point lists can only be reloaded if you have saved them before.
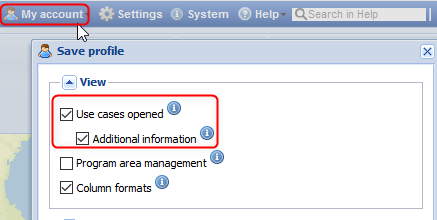
If you want to log out but still have several route planning tabs open, you can save the view in your profile. The next time you start, the use cases are restored with the stop-off points, vehicles and routing options entered.
Save the stop-off point lists that are to be displayed the next time you start the program.
In the title bar click on My account > Save profile.
The Save profilewindowopens.
In the Viewpane select Use cases opened and Additional information.
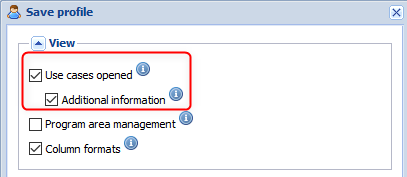
Save the profile.
Tip: If you always want to save the view when you log out, select the option Automatically save profile when leaving under My account.
In the settings, you can define default time slots that are taken into account for each stop-off point.
In the title bar click  Settings.
In the navigation tree select the entry  Route planning > Stop-off points.
In the  Time slot pane set up to three default time slots that will be observed at each stop-off point.
 Observe default time windows
If this option is active, the defined time slots are taken over for each new station are and are considered when calculating the route.
Use for home and destination addresses
If this option is active, the specified time windows are also taken into account for the home and destination address.
You can copy stop-off points to the clipboard with CTRL + C and paste them into a new or existing stop-off point list with CTRL + V.
We have switched to another provider of traffic information that provides significantly more data.
In this turn, we removed the Traffic information use case because the list view of traffic information is not advantageous for route planning.
The traffic information is taken into account during planning as before if the corresponding routing parameter is activated. .
.
Using the Map toolbar > Visibility > Map Objects tab, you can specify whether and which traffic information is displayed on the map.
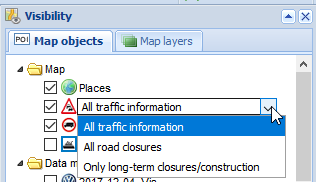
Note: The map displays the traffic information depending on the zoom level. If detailed data is available for a traffic information, such as the length or the expected delay, these are visualized as a tooltip when moving over with the mouse.
|
Copyright © 2019 PTV AG | Legal notice |
 and the route is displayed on the map.